Over 2,000 km of newly developed EuroVelo routes to explore!
The EuroVelo Route Development Status Report of 2022 presents the key facts and numbers of the network, according to current data, and provides a classification of EuroVelo routes and European countries per levels of development. Compared to the 2021 report, it was possible, for the first time ever, to compare the results to those of last year and calculate which countries and which routes saw the biggest increases in development levels!

General findings
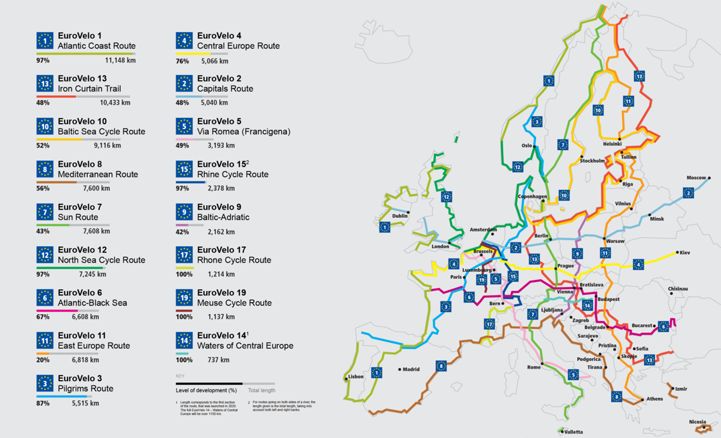
The EuroVelo network has a total length of 93,021 km and currently comprises 17 routes, crossing 38 countries. Contrary to what some users may believe, the EuroVelo network is still a work in progress; all EuroVelo routes are not well developed yet, and some sections are even still under development or at the planning stage. What really ensures the good quality of a EuroVelo route and its level of safety is the Certification label, which is attributed to a route after an on-site survey, if it meets the quality criteria. So far only EuroVelo 15 – Rhine Cycle Route has undergone this process successfully.
But the overall development of the network is progressing quickly, and the news sent by National EuroVelo Coordination Centres and Coordinators (NECC/Cs) all over Europe about ongoing infrastructure projects and newly installed signs are very promising for next year’s Development Status Report! It is also planned to certify more EuroVelo routes in the years to come.
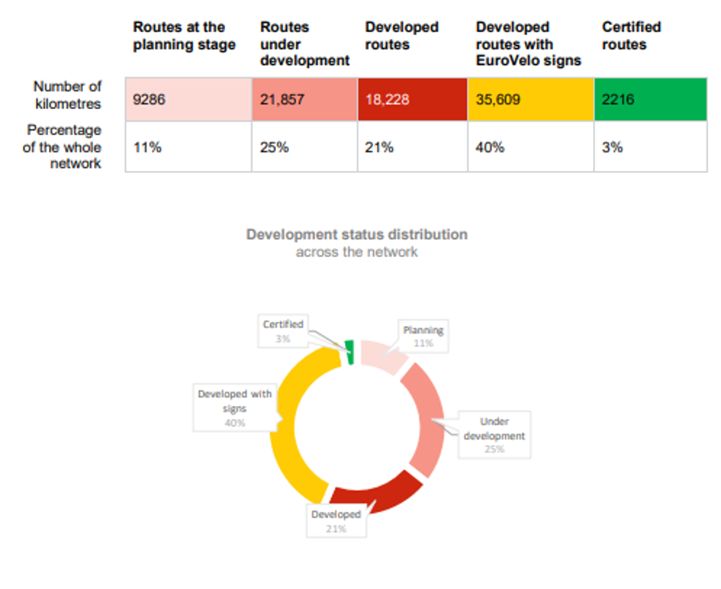
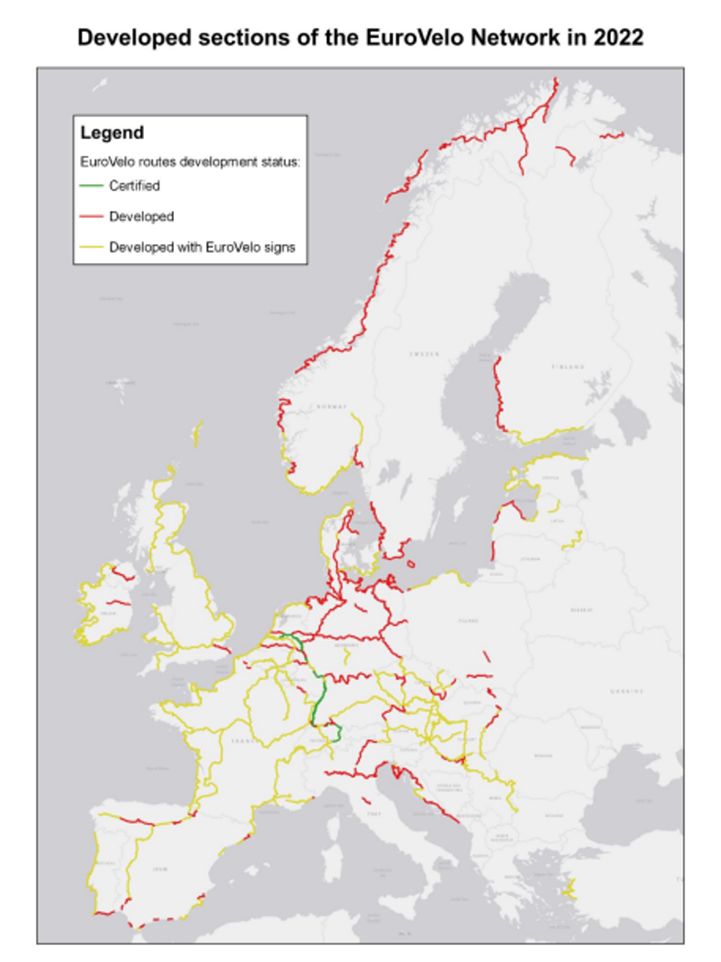
For now, according to the data shared by NECC/Cs and other contact points across Europe, the EuroVelo network is developed1 at 64%, meaning that about 56,000 km of EuroVelo routes are ready to cycle. Among those, 18,228 km (one fifth of the network) are realised and signed according to national standards, 35,609 km (40% of the network) are also signed with EuroVelo signs, and 2,216 km are certified. The remaining 36% of the network still needs improvements, and this is where the efforts of ECF and its partners across Europe will be primarily directed until 2030.

Looking at EuroVelo routes individually, we find that no less than 8 routes are developed at 75% or more! Here is a list of the top performing routes2, ordered according to a weighted sum that gives more importance to certified and signed routes:
1. EuroVelo 15 – Rhine Cycle Route (97% developed and 76% certified)
2. EuroVelo 17 – Rhone Cycle Route (100% developed and signed)
3. EuroVelo 19 – Meuse Cycle Route (100% developed and signed)
4. EuroVelo 14 – Waters of Central Europe (100% developed and signed)
5. EuroVelo 12 – North Sea Cycle Route (97% developed and 72% signed)
6. EuroVelo 1 – Atlantic Coast Route (97% developed and 69% signed)
7. EuroVelo 3 – Pilgrims Route (87% developed and 50% signed)
8. EuroVelo 6 – Atlantic-Black Sea (67% developed, but 62% signed!)
9. EuroVelo 4 – Central Europe Route (76% developed and 42% signed)
Bringing 90,000 km of cycling routes to high quality standards of infrastructure, signposting and services is a tremendous job, but we are getting there, one kilometre (or one hundred!) at a time. Thinking of the journey already traveled since the launch of the EuroVelo network 25 years ago in 1997, when it was only a beautiful dream in the heads of some cycle enthusiasts and a few lines on a map, those 64% developed and 40% signed routes are a truly amazing achievement.
Major progress since 2021
This year, it was possible for the first time ever to make a comparison between the development levels of EuroVelo routes and European countries form year to year. In general, the comparison shows noticeable improvements over the last twelve months. The number of EuroVelo route kilometres signed with EuroVelo signs increased by 7%, corresponding to 2,377 kilometres of new EuroVelo signs to follow, and there was an increase of 8% in the length of developed EuroVelo routes, signed with or without EuroVelo logos.

Based on these calculations, three routes stand out with increases of over 10% in their development levels:
1. EuroVelo 10 – Baltic Sea Cycle Route: increase of 15% stemming from the development of the route in Finland, between Vaasa and Turku, and the signage between Turku and the Russian border.
2. EuroVelo 3 – Pilgrims Route: increase of 14% mostly linked to new route developments and signage in Spain, where it is now entirely developed.
3. EuroVelo 1 – Atlantic Coast Route: increase of 13% mostly connected to new developments of the route in Ireland, where it is now completely developed and signed with EuroVelo signs.
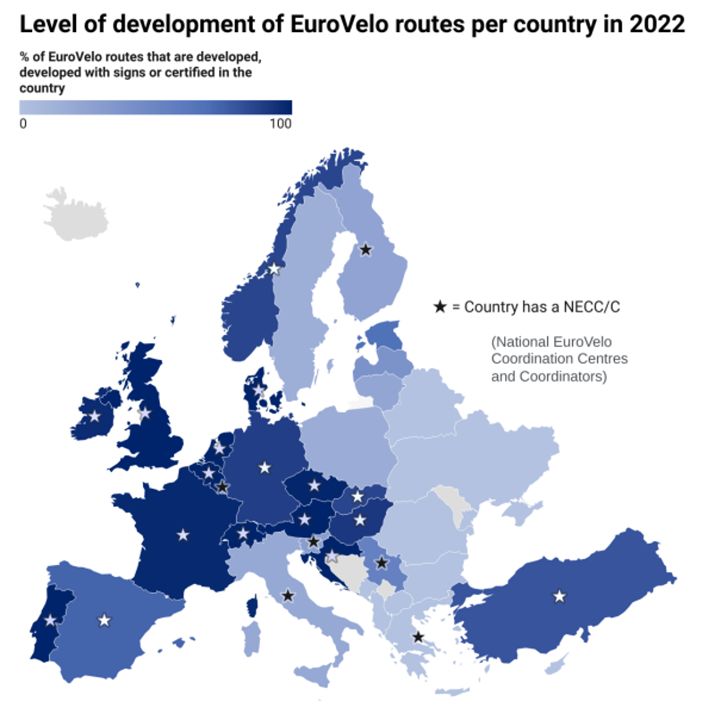
A few countries also stand out for their impressive efforts in raising the development and signage levels of the EuroVelo routes crossing their territories. Here are some of the most impressive figures:
1. In Spain, the development and signage of parts of EuroVelo 8 – Mediterranean Route, EuroVelo 3 – Pilgrims Route and EuroVelo 1 – Atlantic Coast Route (for a total of 1352 km of better route quality and signage) resulted in an increase of 35%.
2. In Finland, the development and signage of 1087 km of the southern section of EuroVelo 10 – Baltic Sea Cycle Route resulted in an increase of 15% of the very long routes crossing this country.
3. In the Republic of Ireland, the development and signage of 1026 km of EuroVelo 1 – Atlantic Coast Route resulted in an increase of 40% in development levels.

What about other data?
Beyond the route development levels, a lot of interesting data can be gathered on the EuroVelo network and we are putting a lot of efforts to further develop these resources. On the EuroVelo Data Hub you can find data gathered on network usage, from a sample of 170 automatic counters installed by Eco-Counter and its local partners, and web statistics data as well.
Author: Florence Grégoire
Cover picture: EuroVelo 8 - Malaga © Publics Works Agency
1. An explanation of what the categories “developed”, “developed with signs” and “certified” mean is available in our F.A.Q.
2. This classification was done according to data received from NECC/Cs, and not from detailed survey data comparable across Europe.